University News
DUNE-EOLE Project: focus on action 2.2 learning analytics
Learning Analytics (or "digital learning analytics") can be defined as the collection, analysis and smart use of data produced by the learner in a learning situation. Learning Analytics appeared with the spread of digital education (digital workspace, educational resources, online digital services, etc.) and consequently the availability of big digital data on learning. Their use allows different types of experience feeedback to the learner, the tutor or the trainer, peers, the designer of the resource or the institution, most often in the summarised form of indicators, predictors, visualisation tools (notably dashboards) or intervention systems such as personalised recommendation systems.
Action 2.2 of the DUNE EOLE project, led by the University of Lorraine, focuses on the design and implementation of dashboards for students. Teachers from the Lorraine Management Innovation collegium (working on the Maths and Computer Science applied to the Human and Social Sciences (MIASHS) Bachelor’s degree and Economic and Social Administration (AES) Bachelor’s degree) and Distance Learning Resources and Studies (ERUDI) agreed to participate in the trial, thus making it possible to explore the potential contribution of Learning Analytics to the motivation of students, both in the context of face-to-face training and distance learning. In addition, a multi-profile team brings together staff from the Digital Department and KIWI team researchers from the LORIA laboratory.
The project is structured into four main stages:
1) Data mapping and development of a data infrastructure to store the information collected. The project started with the census and selection of the educational data available and usable under the GDPR. For the time being, traces of student activities on the ARCHE (Moodle) University of Lorraine online course platform and metadata on educational resources are used when available. The tools to consolidate the selected data then had to be designed, developed and implemented so that it can be automatically exploited by artificial intelligence algorithms.
2) Development of algorithms to determine student activity indicators in a lesson. First of all, it should be recalled that educational data has characteristics which make its automatic exploitation complex: it is heterogeneous (notes, clicks, logs, votes, etc.), possibly ambiguous (for example, an absence of activity observed in the data may correspond to real inactivity of the learner or work on the printed version of course materials), with different timelines (results of the jury each semester or traces of continuous activities on a platform). Automatic analysis of collected data therefore requires complex exploration and modelling techniques, resulting in particular from data mining or machine learning.
3) Design of a dashboard for students. The dashboard was designed in collaboration with volunteer teachers (during focus groups, for example, they discussed the relevance of indicators) and students (during workshops, for example, they expressed what they would like to have as a dashboard). Thus, discussions with the L1 MIASHS students showed the importance they attach to what can be summed up as "algorithmic benevolence", i.e. an approach which values the efforts and commitment of the student with a numerical score. Similarly, it appeared that the student wants to be the sole recipient of the dashboard: he or she must remain free to consult it or not, to share it or not with certain peers, the course teacher or his or her referent teacher. A visual interface making it possible to report to the students the results of the algorithms which analyse their learning traces was designed and developed. This interface is the result of a co-design with a total of more than 300 students involved.
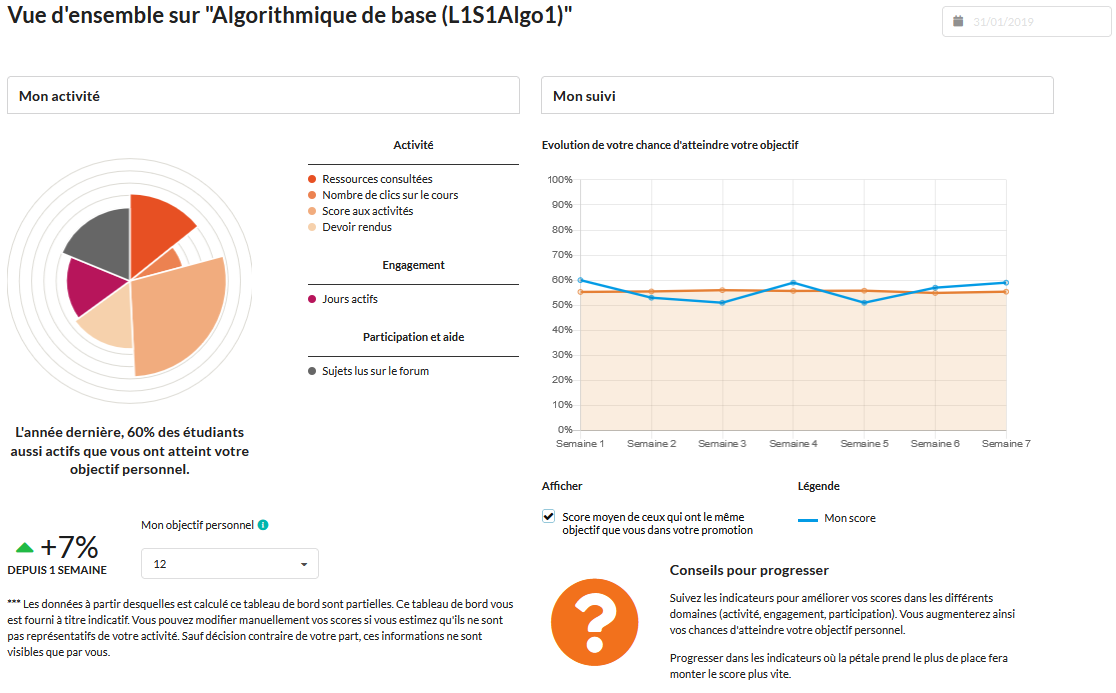
The student dashboard is divided into two columns representing two types of information. The left-hand part relates to the student’s activity, the actions he or she carried out during his or her learning. This visual rendering of the student’s activity enables him or her to quickly identify the actions he or she could take to make further progress. The right-hand part represents the change in the student's scores over time. The student can also, if he or she wishes, display the evolution of the average score of the students in his or her year. Finally, some advice is given to the students to help them interpret and use the information in the dashboard.
Example of a dashboard for the Algorithmic 1 lesson in MIASHS S1 L1 (image below).
4) Setting up a trial. The establishment of a student dashboard is based on the scenario of digital interactions between the student and the ARCHE platform. It is therefore essential that the student regularly accesses his or her course space, which can be helped by uploading quizzes, materials regularly accessed, etc. Similarly, comments like "last year, 60% of students as active as you reached your personal goal" require that you have at least one reference year. The dashboards are calculated for project "trial" courses and will be presented to the students concerned. Students will then be questioned in order to collect their comments and assess their perception of the contribution of this new tool.
This work benefited from state aid managed by the National Research Agency under the “Investments for the Future” programme under reference ANR-16-DUNE-0001-EOLE.